CreateGalleries.py | Venice, Italy | Unit 21 | 2020
Awarded Distinction for Design & Distinction for Thesis
Awarded The Bartlett Medal
Click to see Thesis
Click to see 4th year work
Click to zoom in ->

Optimisation through Fragmentation in Venice
This project is centred around the concept of how technologies that determine the way in which the digital environment is navigated could start to inform the built environment. The primary topic that is taken as a vantage point is that of Recommender Systems, and how this technology has influenced the way in which media are consumed on digital platforms. This technology provides a high degree of customisation to its users which was not possible when these media were consumed through more static entities. In music think of how the album has been replaced by the playlist as the dominant entity.
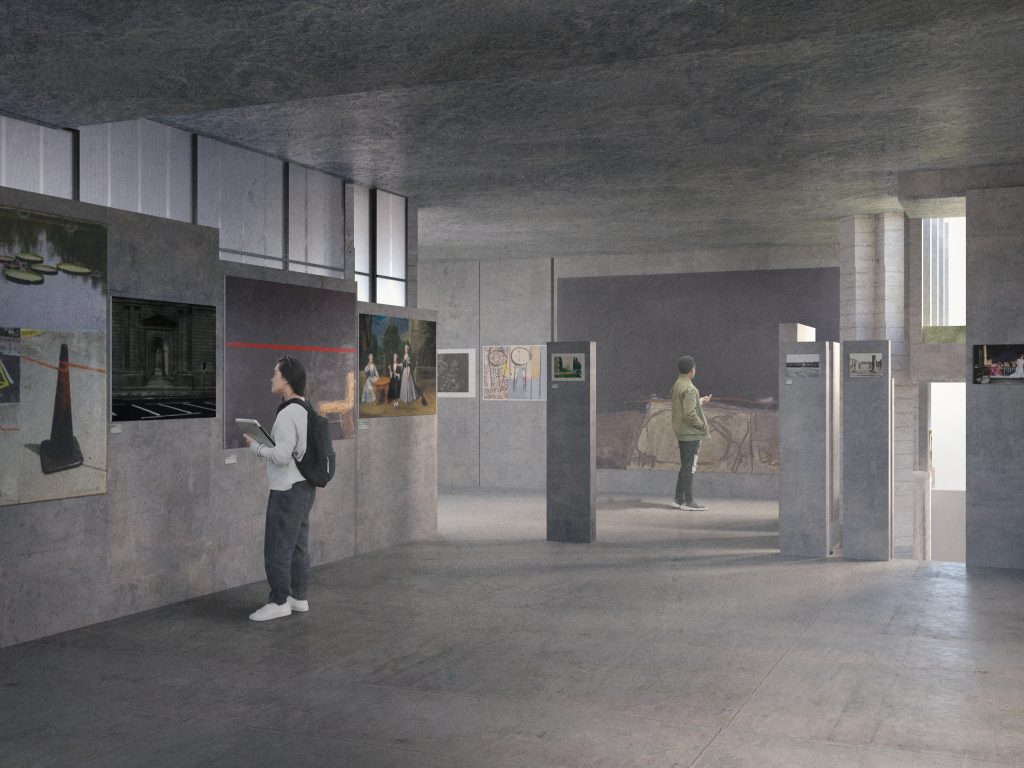
This idea of optimisation through fragmentation where a new whole is arranged out of the broken down elements of the old entity is the leading concept of the project. A method is developed where a customised collection of art is put forward for one particular location, after which a gallery is defined based on the qualities of this particular collection. This method is applied in an abstracted way making it applicable to any location by means of programming in python and importing the output into rhino through grasshopper. The algorithm is applied to the city Venice, producing a variety of 1297 gallery recommendations, each with their own collection and specific qualities determined by location.
The city Venice has as much of a presence within the digital landscape as it does within the physical environment. Everyone who has visited this city in modern times has already had a pre-determined image through various digital media ranging from images to film. This interactive map of Venice is solely determined by mapping one instance of this digital footprint, in this case loca- tions of geo tagged Flickr posts.Not only do the streets and canals of Venice become visible by plotting these coordinates, it is also possible to start analysing the relationships between these lo- cations based on user behaviour. Here the paths of the users that have been to St. Marks square have been drawn. This facilitates the creation of a relational graph of physical locations through the analysis of its digital counterpart.

Recursively breaking down a grid into smaller cells if the parent cell does not contain a uniform distribution of coordinates. Afterwards the cells with corresponding density were connected. This produces a division of locations based on the digital presence.
For each location the Flickr photos were grouped together to form 2706 categories. These categories were used to train an image recognition model, based on a Convolutional Neural Ne work. This model then classifies any given image into one of the locations.
All available art pieces of the combined digital collection of the TATE and MoMA were then fed through this model, a total of 130178 pieces of art. This results in art collections curated to correspond to the visual qualities of each location.

This image is a representation of the training process of a neural network. Each row is an output, and each 1px column a path from input to that output. The further in the training process the more distinguished the positive and negative values become (visible as red and blue).


A GAN (Generative Adversial Network) was then trained on the art collection in order to create a new ‘Art Piece’ for each particular collection. This piece theoretically represents the average visual qualities of that collection.
For each collection, including the generated art piece, a graph is created where the edges represent the similarity between art pieces. From this graph a minimum spanning tree is created, with the GAN image as root. This creates a hierarchy within the collection where the transitions between art pieces are as gradual as possible.
From the shape of the tree in terms of main branches and sub branches sub collections are determined which are to be displayed in one space. The dimensions of each sub collection inform the size and shape of each room, which are then put in sequence to form an initial volumetric massing for the design of a customised gallery.
This method is then applied to each collection at every location. On location the existing building footprints are examined to find an area that corresponds to the area required for that particular collection. Then the massing algorithm is given the existing footprint as a constraint.
The result is 1297 different gallery proposals with varying sizes and shapes, depending on the size of the curated art collection.
Click to open full resolution image in new tab ->

Click to open booklet ->

After the placement of the art and the volumetric massing of each gallery visibility graphs were used to compute a valid circulation for each gallery.

The placement of walls and windows is entirely determined through the possible views from the location. These views are interpreted by the classification model, after which a set of key views are selected. These serve as a vector-field which informs the placement of windows if it offers a view, or the slight rotation of wall segments in accordance to the orientation of the vector-field.

Click to open full resolution image in new tab ->


